Training Score: How to Read Your Cardio and Strength Load
By The HYBRD Team
Every training app has a load number. Almost all of them build it from heart rate over time, which means a brutal squat session reads as a moderate cardio day and a gentle 90-minute ride reads as harder than it was. HYBRD splits load in two: every workout generates a cardio load and a strength load, and both get counted.
Your Training Score is what those two add up to over six weeks. In the app's own words: every workout you do generates cardio and strength Training Load, the Training Score represents the accumulation of Training Load over the last 6 weeks, and increasing your Training Score increases your preparedness to perform. Think of it as how hard you have been studying for the test.
Why the split matters
Heart rate elevation during heavy lifting happens for different physiological reasons than it does during endurance work, so a single heart-rate-derived number systematically undervalues strength work. We went into the mechanism in the "did I even work out?" problem. The Training Score is the practical answer to it.
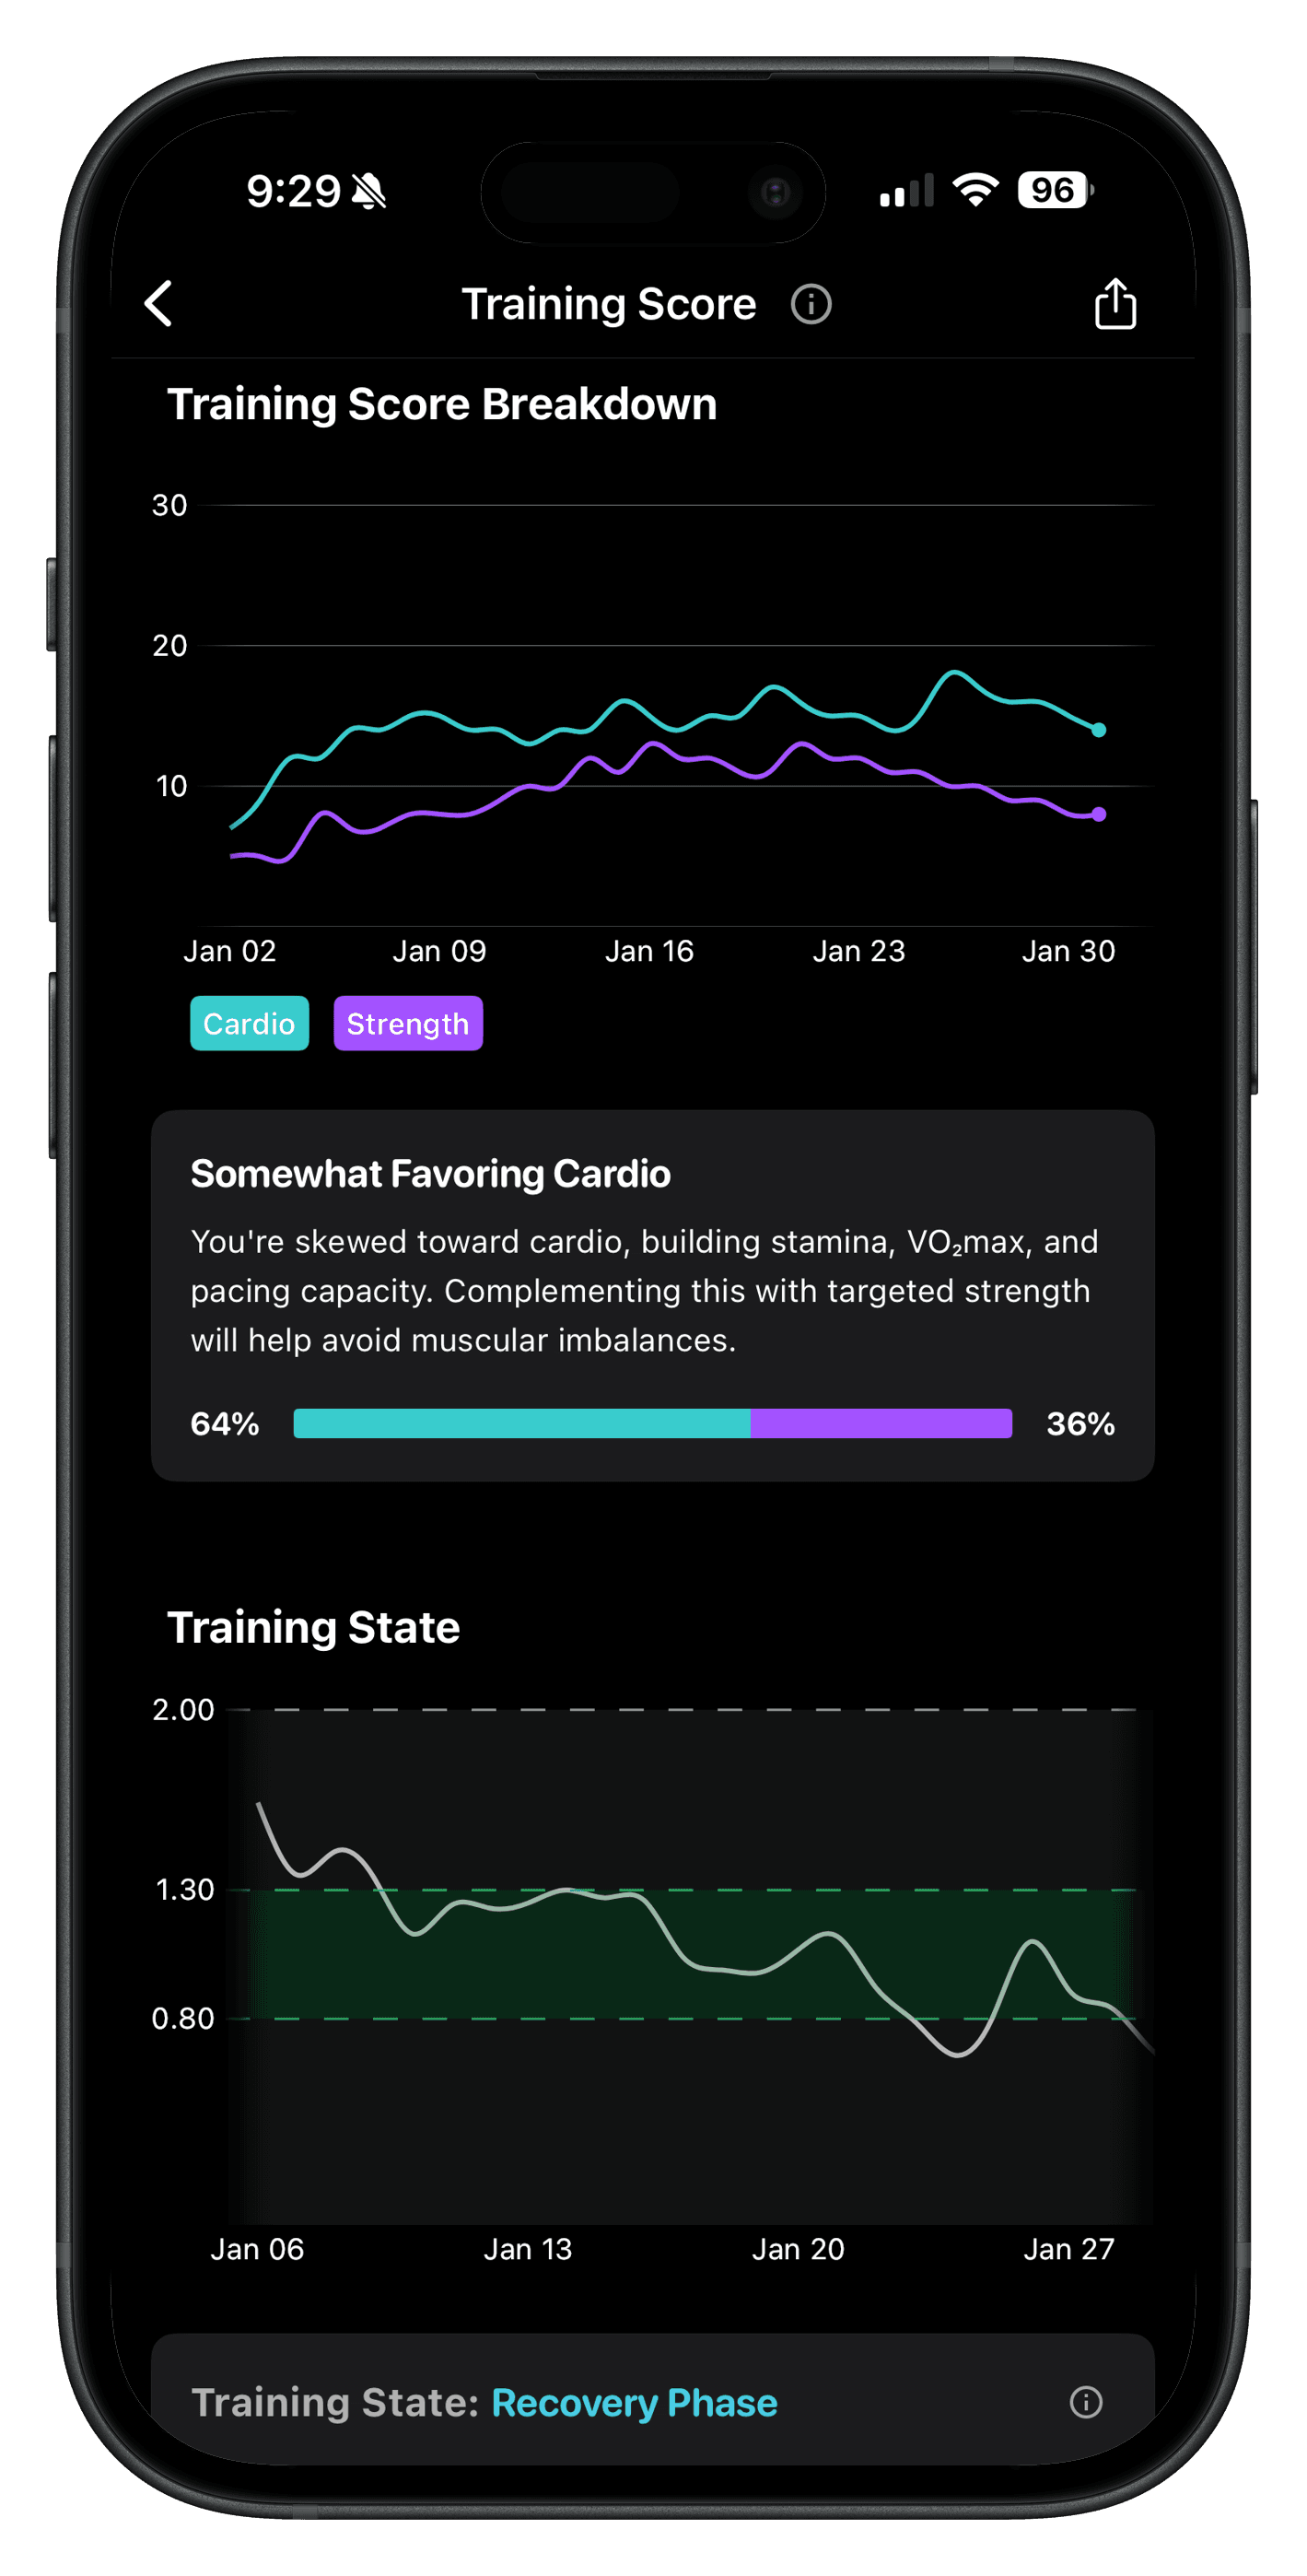
The screen breaks the six weeks into two lines, cardio and strength, and then tells you the ratio between them in plain language. A read of "somewhat favoring cardio" at 64% to 36% comes with the reason it matters: you are building stamina, VO₂max, and pacing capacity, and complementing that with targeted strength will help you avoid muscular imbalances.
That is the number to check when you feel like you are working hard and going nowhere. Most of the time the split says exactly what happened: one side of your training quietly took over.
Training State: the green band
Below the breakdown sits a second chart that is arguably more useful day to day. Training State compares your last 7 days of load against your usual level over the last 21 days, and draws a green band you want to stay inside.
The band runs from 0.80 to 1.30. Above 1.30 you are piling on load faster than your recent baseline supports, which is the classic pattern behind overuse injuries. Below 0.80 you are training less than you have been, which is what a taper or a deload is supposed to look like and what an unplanned quiet fortnight also looks like. Inside the band, load is building at a rate you are absorbing.
Because it is a ratio, it is self-calibrating. A high-volume athlete and a beginner both sit near 1.0 when their training is steady. And because it is a rolling comparison, one big weekend does not spike it as hard as three big weekends in a row.
Per-workout load
Open any completed workout and the same model shows up at the session level under Training Insights: cardio load, strength load, total load, and total intensity for that one session, plus how many points it added to your Training Score. It appears for strength, functional fitness, cardio, and mobility sessions.
This is where the model stops being abstract. You can see that yesterday's "easy" leg day was 25% cardio and 75% strength and put eight points on the board, which is why today's tempo run feels the way it does.
What to actually do with it
- Use the cardio/strength split to catch drift. If you meant to be balanced and you are at 70/30, the fix is a programming change, not more effort
- Treat a Training State above 1.30 for more than a week as a warning, not a badge. That is the window where niggles become injuries
- Treat a dip below 0.80 as information about the last three weeks, not about today. If it was not a planned deload, your week fell apart and it is worth knowing why
- Do not chase the Training Score upward indefinitely. It measures accumulated load, so it rewards volume; the point of a taper is that the number comes down while your performance goes up
For the training side of the same question, we cover how to lay out the week in balancing running and lifting, and what stacking your hardest days does to recovery in why your hardest training days ruin your sleep.
Where to find it
Home tab, tap the Training Score card. The info icon in the header gives you the definition, and the detailed breakdown with Training State is on the same screen. Per-workout load is on each completed workout under Training Insights. The detailed breakdown is part of a HYBRD subscription; the score itself and the per-workout load are not.
Key Takeaways
- Every workout generates both cardio and strength load, so lifting is not undervalued the way a heart-rate-only model undervalues it
- The Training Score is those two accumulated over the last six weeks, a proxy for preparedness rather than for today's effort
- The balance read tells you the ratio between them in plain language, which is how you catch a plan quietly drifting cardio-heavy
- Training State is your last 7 days over your last 21, with an optimal band from 0.80 to 1.30. Above it is injury risk, below it is detraining or a taper
- The same split appears on every completed workout under Training Insights, with the points that session added